SOMz: Self Organizing Maps and random atlas
SOMz [1] is a unsupervised machine learning technique that also computes photometric redshift PDFs. Specifically, we have developed a new framework that we have named random atlas, which mimics the random forest approach by replacing the prediction trees with self organizing maps (SOMs). A SOM is essentially a neural network that maps a large training set via a process of competitive learning from a high dimensional input space to a two-dimensional surface. The mapping process retains the topology of the input data, thereby revealing potential unknown correlations between input parameters, which can provide important insights into the data.
This is an unsupervised learning method as no prediction attributes are included in the mapping process, only the non-prediction attributes are included. The output values from the training data are only used after the map has been constructed as they can be used to generate the prediction model for each cell in the map. In our implementation , we first construct a suite of maps that each use a random subset of the full attributes and the randomized training data we developed for the random forest, and we then aggregate the map predictions together to make our final prediction (via the random atlas).
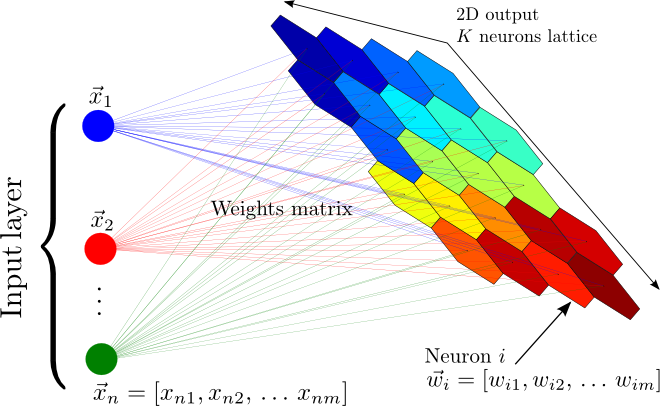
A schematic representation of a self organized map. The color of the map encodes the organization of groups of objects with similar properties. The main feature of the SOM is that produces a nonlinear mapping from a m-dimensional space of attributes to a two-dimensional lattices of neurons
In the code SOMz is implemented as a module SOMZ to create, evaluate, plot and make prediction. Given the nature of the algorithm this can also be used for both, regression and classifcatin it just a matter of changing the attributes when evaluating. For more details refer to the SOMz paper
Example
This is a simple example on how to use the SOMZ, visualize a map and make a simple prediction. To see an example of using this properly in a problem under the MLZ framework , see Running a test
from numpy import *
import os, sys
path_src = os.path.abspath(os.path.join(os.getcwd(), '../../'))
if not path_src in sys.path: sys.path.insert(1, path_src)
from mlz.ml_codes import *
#X and Y can be anything, in this case SDSS mags and colors for X and photo-z for Y
X = loadtxt('SDSS_MGS.train', usecols=(1, 2, 3, 4, 5, 6, 7), unpack=True).T
Y = loadtxt('SDSS_MGS.train', unpack=True, usecols=(0,))
#Calls the SOMZ mode
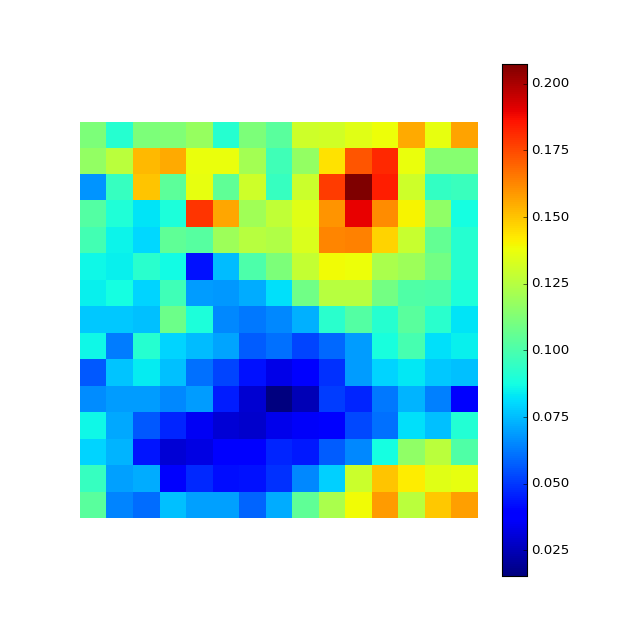
M = SOMZ.SelfMap(X,Y,Ntop=15,iterations=100,periodic='yes')
#creates a map
M.create_mapF()
#evaluates it with the Y entered, or anyoher desired colum
M.evaluate_map()
#plots the map
M.plot_map()
#get prediction values for a test data (just an example on how to do it)
#using a train objetc
values = M.get_vals(X[10])
print
print 'mean value from prediction (hex)', mean(values)
print 'real value', Y[10]
#Note we use a low-resoution map and only one map for example purposes
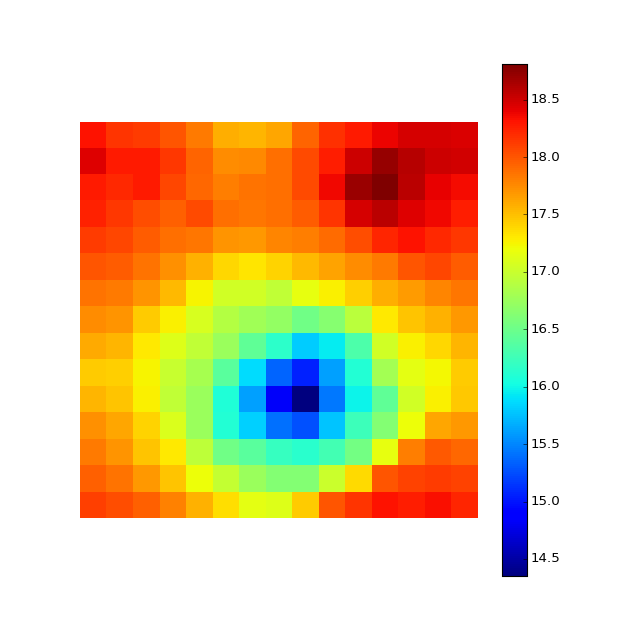
#evaluate other column, for example the 'g' magnitude
M.evaluate_map(inputY=X[:,1])
M.plot_map()
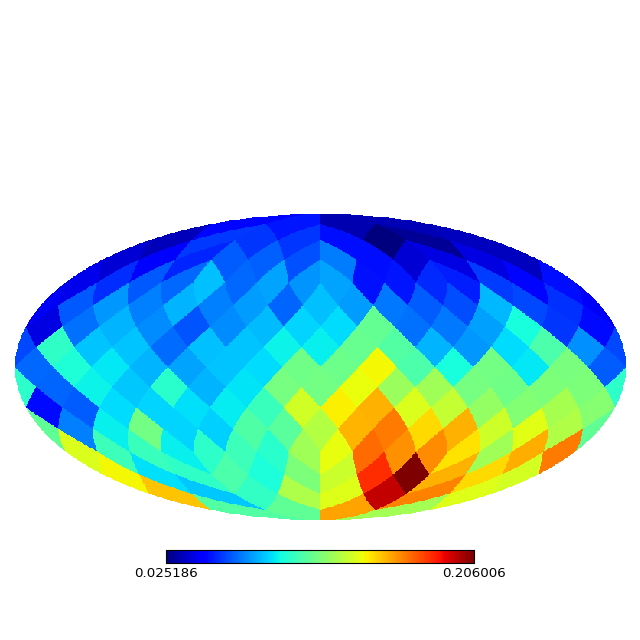
#Try other topology
M = SOMZ.SelfMap(X,Y,topology='sphere',Ntop=4,iterations=100,periodic='yes')
#creates a map
M.create_mapF()
#evaluates it with the Y entered, or anyoher desired colum
M.evaluate_map()
#plots the map
M.plot_map()
#get prediction values for a test data (just an example on how to do it)
#using a train objetc
values = M.get_vals(X[10])
print
print 'mean value from prediction (sphere)', mean(values)
print 'real value', Y[10]
You can download this example and run it on a python console to see the outputs and try different topologies, properties and resolutions.
References
| [1] | Carrasco Kind, M., & Brunner, R. J., 2014, “SOMz : photometric redshift PDFs with self organizing maps and random atlas” , MNRAS, 438, 3409 (Link) |