TPZ: Trees for Photo-Z
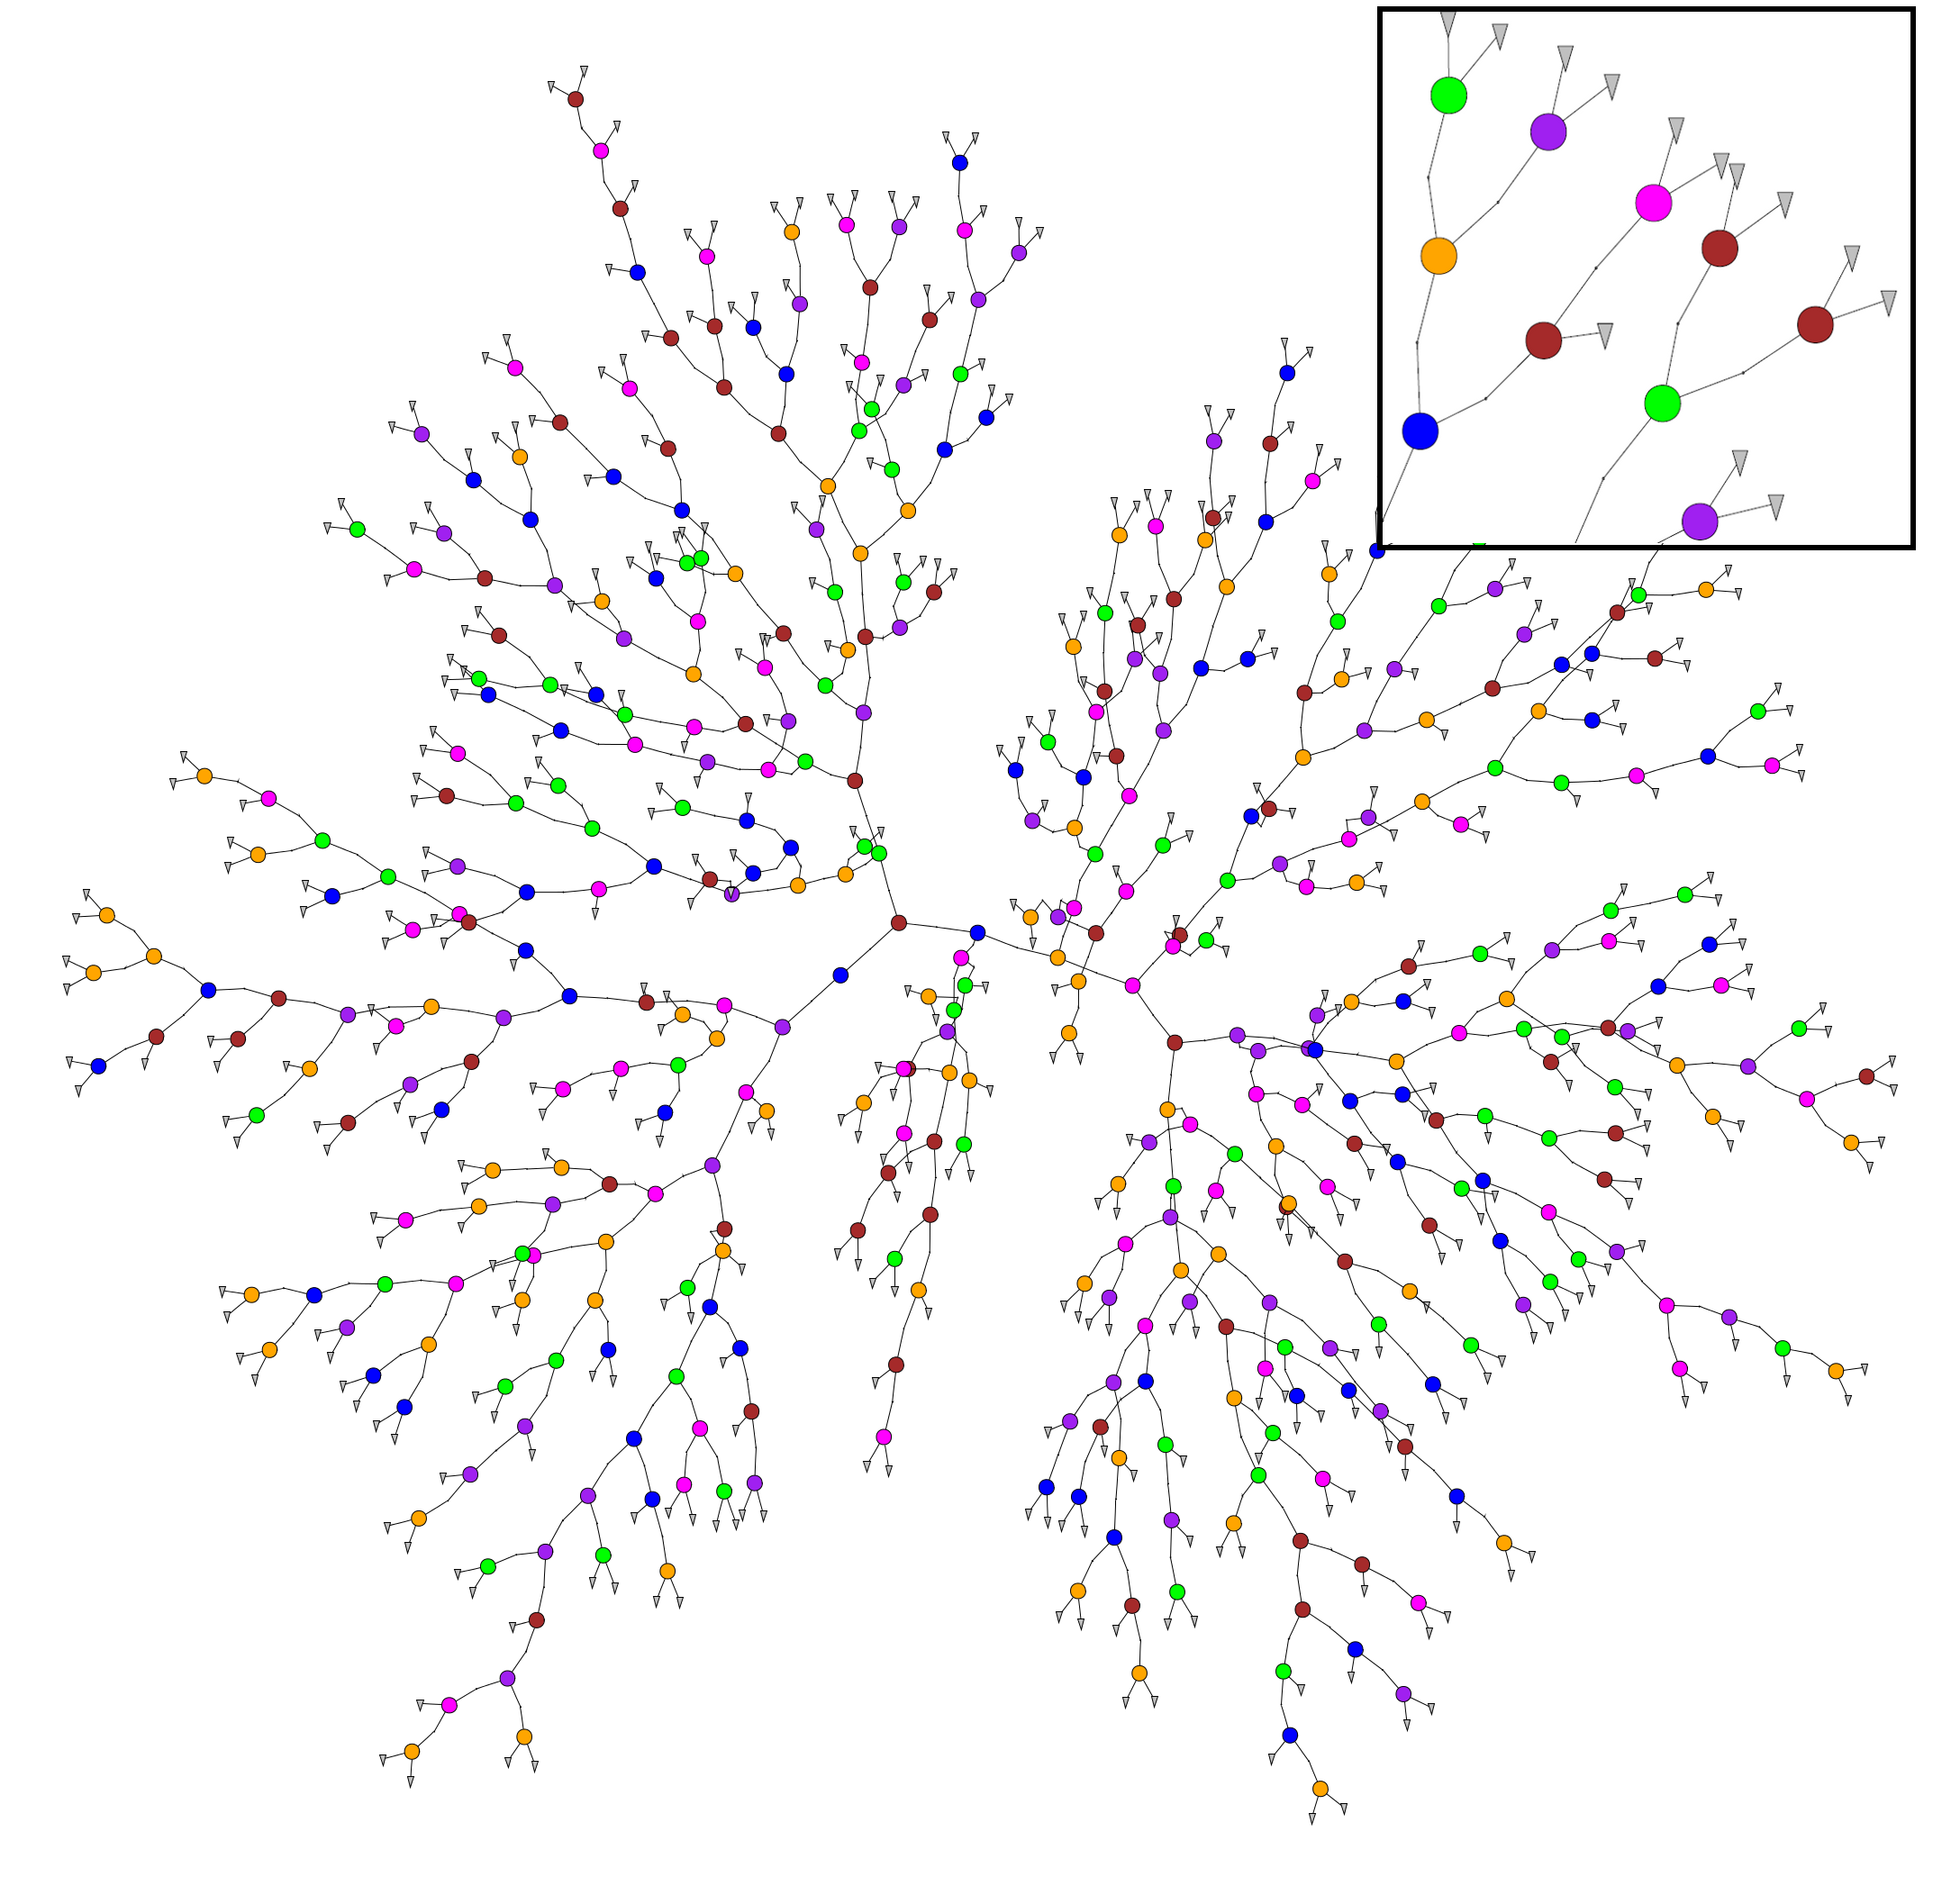
TPZ [1] is a supervised machine learning, parallel algorithm that uses prediction trees and random forest techniques to produce both robust photometric redshift PDFs and ancillary information for a galaxy sample. A prediction tree is built by asking a sequence of questions that recursively split the input data taken from the spectroscopic sample, frequently into two branches, until a terminal leaf is created that meets a stopping criterion (e.g., a minimum leaf size or a variance threshold).
The dimension in which the data is divided is chosen to be the one with highest information gain among the random subsample of dimensions obtained at every point. This process produces less correlated trees and allows to explore several configurations within the data.
The small region bounding the data in the terminal leaf node represents a specific subsample of the entire data with similar properties. Within this leaf, a model is applied that provides a fairly comprehensible prediction, especially in situations where many variables may exist that interact in a nonlinear manner as is often the case with photo-z estimation.
In the code TPZ is implemented as a module which has 2 important classes: TPZ.Rtree for regression and TPZ.Ctree for classification. Both are documented in the code and listed below. For more information please refer to the TPZ paper
Warning
In order to visualize the created trees you need to have installed Graphviz, usually is installed by default on Linux and Mac OS systems You don’t needed it in order to run MLZ
Example 1
This is a simple example on how to use the TPZ.Rtree, visualize a tree and make a simple prediction. To see an example of using this properly in a problem under the MLZ framework , see Running a test
from numpy import *
import os, sys

path_src = os.path.abspath(os.path.join(os.getcwd(), '../../'))
if not path_src in sys.path: sys.path.insert(1, path_src)
from mlz.ml_codes import *

#X and Y can be anything, in this case SDSS mags and colors for X and photo-z for Y
X = loadtxt('SDSS_MGS.train', usecols=(1, 2, 3, 4, 5, 6, 7), unpack=True).T
Y = loadtxt('SDSS_MGS.train', unpack=True, usecols=(0,))

#this dictionary is optional for this example
#for plotting the color labels
#(automatically included in MLZ)
d = {'u': {'ind': 0}, 'g': {'ind': 1}, 'r': {'ind': 2}, 'i': {'ind': 3}, 'z': {'ind': 4}, 'u-g': {'ind': 5},
     'g-r': {'ind': 6}}

#Calls the Regression Tree mode
T = TPZ.Rtree(X, Y, minleaf=30, mstar=3, dict_dim=d)
T.plot_tree()
#get a list of all branches
branches = T.leaves()
#print first branch, in this case left ,left, left, etc...
print 'branch = ', branches[0]
#print content of branch
content = T.print_branch(branches[0])
print 'branch content'
print content
#get prediction values for a test data (just an example on how to do it)
#using a train objetc
values = T.get_vals(X[10])
print 'predicted values from tree'
print values
print
print 'mean value from prediction', mean(values)
print 'real value', Y[10]
#Note we use a shallow tree and only one tree for example purposes and there
#is a random subsmaple so answer changes every time


If you download this example and run it on a python console you would get the following output, although the final line would change slightly as there is a random process involved which would also change the figures:
>>> branches = T.leaves()
>>> print 'branch = ', branches[0]
branch =  ['L', 'L', 'L', 'L', 'L']
>>> content = T.print_branch(branches[0])
>>> print 'brach content'
branch content
>>> print content
[ 0.024914  0.029343  0.005126  0.017902  0.019716  0.02609   0.004404
  0.006451  0.003074  0.034597  0.005701  0.003923  0.032468  0.031017
  0.023015  0.038875  0.010996  0.018425  0.007773  0.013524  0.024911
  0.003017  0.013113  0.006682  0.007372  0.021268]
>>> values = T.get_vals(X[10])
>>> print 'predicted values from tree'
>>> print values
[ 0.120684  0.118015  0.108008  0.103931  0.11477   0.099268  0.106299
  0.114634  0.11031   0.115252  0.102601  0.132789  0.12069   0.125127
  0.115067  0.086241  0.115476  0.112288  0.096661  0.105071  0.108449
  0.119887  0.111333  0.120343  0.130859  0.104452  0.126068  0.095225
  0.102079  0.123717  0.118518  0.116976  0.094429  0.107744  0.111157
  0.095198  0.127612  0.114376  0.105994  0.117298  0.105951  0.09058
  0.118837  0.108803  0.114075  0.159866  0.116929  0.086987  0.099276
  0.088263  0.117582  0.119883  0.126069  0.117097  0.110187  0.099429
  0.102188  0.105896  0.107781]
>>> print 'mean value from prediction', mean(values)
mean value from prediction 0.111365677966
>>> print 'real value', Y[10]
real value 0.120684
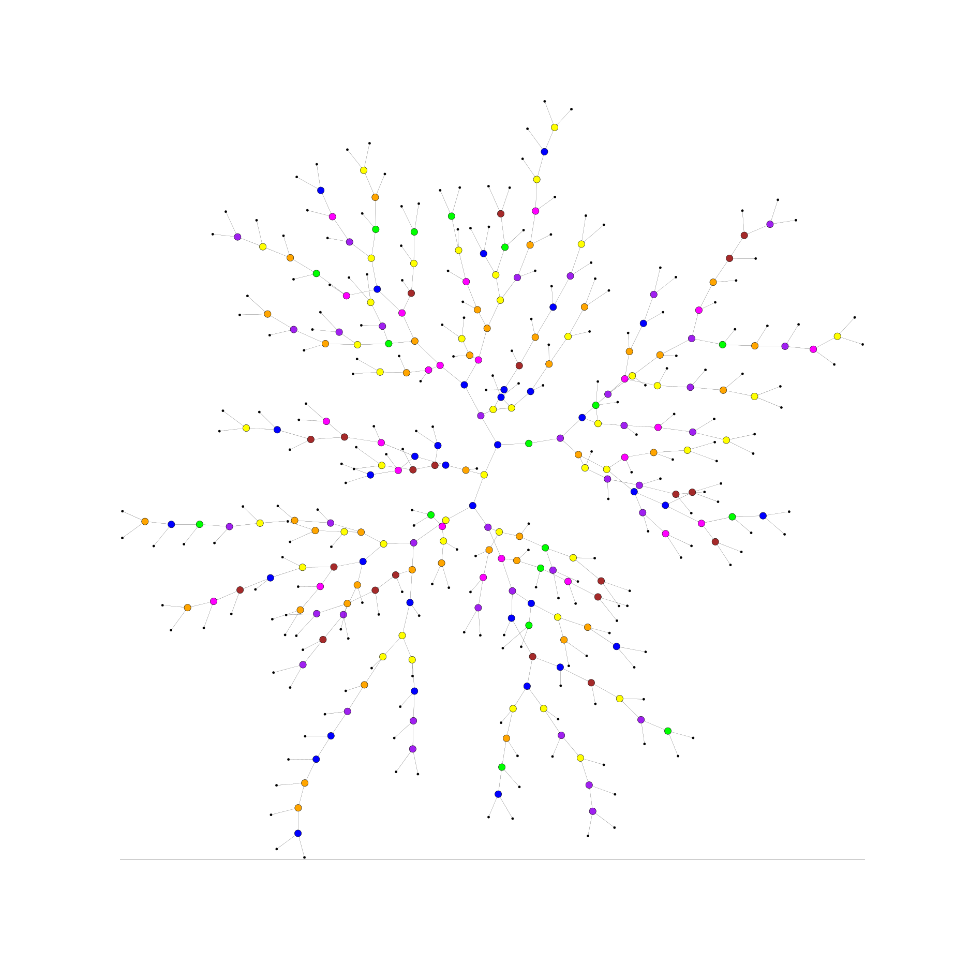
Example 2
from numpy import *
import os, sys

path_src = os.path.abspath(os.path.join(os.getcwd(), '../../'))
if not path_src in sys.path: sys.path.insert(1, path_src)
from mlz.ml_codes import *

#X and Y can be anything, in this case SDSS mags and colors for X and photo-z for Y
X = loadtxt('SDSS_MGS.train', usecols=(1, 2, 3, 4, 5, 6, 7), unpack=True).T
Y = loadtxt('SDSS_MGS.train', unpack=True, usecols=(0,))

#make two classes by separating Y in low and high redhisft for example

Y = where((Y > 0.15), 1, 0)

#0: low redshift, 1: high redshift

#this dictionary is optional for this example
#for plotting the color labels
#(automatically included in MLZ)
d = {'u': {'ind': 0}, 'g': {'ind': 1}, 'r': {'ind': 2}, 'i': {'ind': 3}, 'z': {'ind': 4}, 'u-g': {'ind': 5},
     'g-r': {'ind': 6}}

#Calls the Classification Tree mode
T = TPZ.Ctree(X, Y, minleaf=20, mstar=3, dict_dim=d, nclass=array([0, 1], dtype='int'))
T.plot_tree()
#get a list of all branches
branches = T.leaves()
#print first branch, in this case left ,left, left, etc...
print 'branch = ', branches[0]
#print content of branch
content = T.print_branch(branches[0])
print 'branch content'
print content
#get prediction values for a test data (just an example on how to do it)
#using a train objetc
values = T.get_vals(X[20])
print 'predicted values from tree'
print values
print
print 'mean value from prediction', int(round(mean(values)))
print 'real value', Y[20]
#Note we use a shallow tree and only one tree for example purposes and there
#is a random subsmaple so answer changes every time
References
| [1] | Carrasco Kind, M., & Brunner, R. J., 2013 “TPZ : Photometric redshift PDFs and ancillary information by using prediction trees and random forests”, MNRAS, 432, 1483 (Link) |